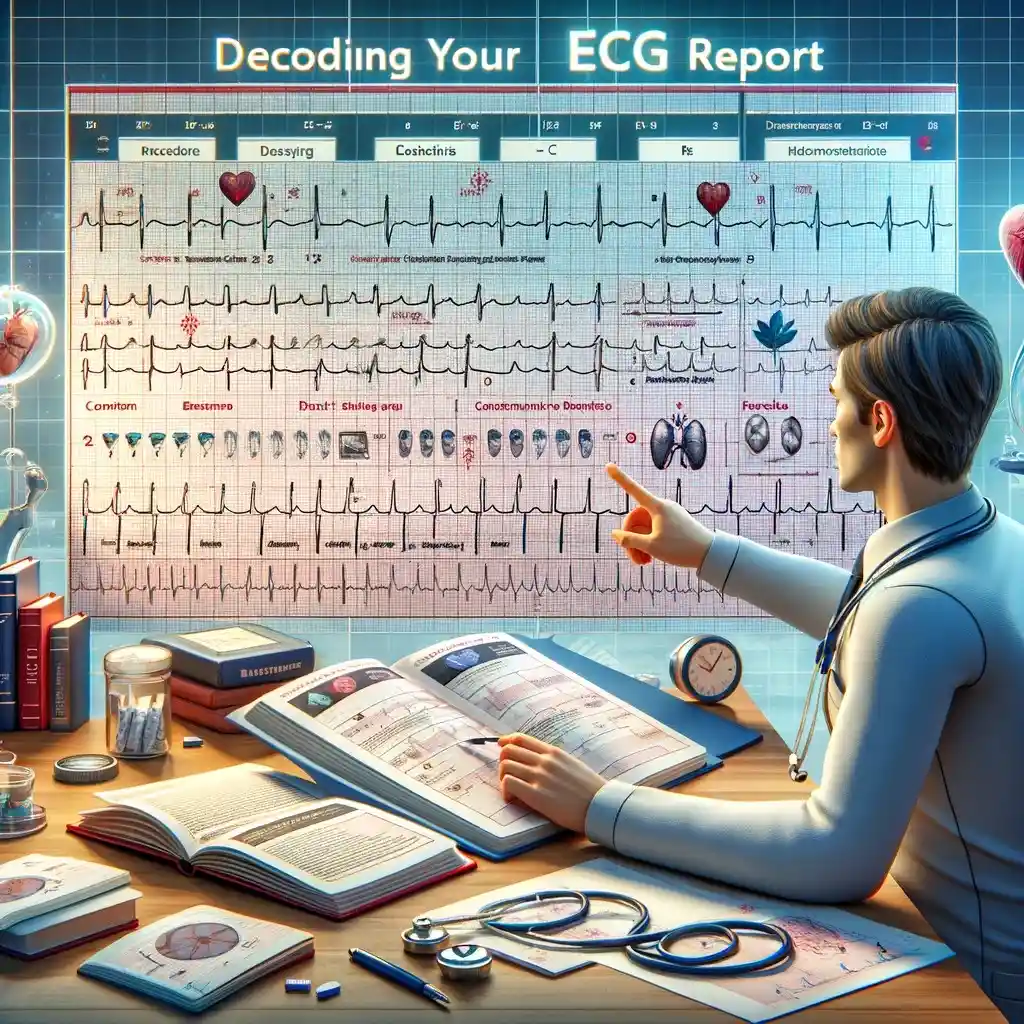
In the heart of a small town, where every heartbeat tells a story, there lived an elderly gentleman named John. One sunny afternoon, while gardening, John felt an unusual flutter in his chest. Concerned, he visited his doctor, who recommended an Electrocardiogram (ECG) test. John, like many, was unfamiliar with the intricacies of an ECG report. This narrative is not unique to John; it resonates with patients, caregivers, and health-conscious individuals worldwide, emphasizing the universal need to understand the language of our hearts through an ECG.
Understanding the ECG Report
An ECG is a graphical representation of the electrical activity of the heart. The report comprises several key components:
- P wave: Represents atrial depolarization, the initial phase where the heart’s upper chambers contract.
- QRS complex: Depicts ventricular depolarization, indicating the contraction of the heart’s lower chambers.
- T wave: Reflects ventricular repolarization, the phase where the ventricles reset electrically and prepare for the next beat.
Each wave, interval, and segment on an ECG provides vital information about the heart’s electrical activity and overall health.
Deciphering the Waves and Intervals
- Rate and Rhythm: The heart rate is calculated from the R-R intervals, the time between two consecutive QRS complexes. A normal resting heart rate ranges from 60 to 100 beats per minute. The rhythm, whether regular or irregular, can also be assessed through these intervals.
- P wave analysis: The presence, size, and shape of P waves are crucial. Absence or abnormality in P waves may indicate atrial fibrillation or other atrial abnormalities.
- QRS complex evaluation: The duration, amplitude, and morphology of the QRS complex are analyzed to assess ventricular health. Abnormalities might suggest ventricular hypertrophy, conduction delays, or previous myocardial infarction.
- ST segment and T wave: These are analyzed for signs of ischemia or infarction. Elevation or depression in the ST segment can be indicative of myocardial ischemia or injury.
By understanding these components, individuals can gain insights into their cardiac health and address potential issues proactively.
Interpreting Basic Findings
- Sinus Rhythm: A regular rhythm with a rate of 60-100 bpm indicates a normal sinus rhythm.
- Arrhythmias: Irregular rhythms, like atrial fibrillation, can be identified through abnormal P waves and irregular R-R intervals.
- Ischemia and Infarction: Changes in the ST segment and T wave can indicate coronary artery disease or previous heart attacks.
- Conduction Abnormalities: Prolonged intervals or bizarre QRS complexes may suggest blockages in the heart’s electrical pathways.
Statistics show that heart disease remains a leading cause of death globally. The World Health Organization (WHO) reports that cardiovascular diseases are responsible for an estimated 17.9 million deaths each year, emphasizing the importance of cardiac monitoring and understanding ECG reports.
Ecotown Diagnostics: Your Partner in Heart Health
At Ecotown Diagnostics, we specialize in providing comprehensive ECG tests, catering to a wide audience, including patients seeking specific medical tests, individuals with chronic conditions, and senior citizens. Our state-of-the-art facilities ensure accurate and detailed ECG reports, aiding in the early detection and management of heart-related conditions.
FAQs
- What is the significance of an abnormal ECG reading?
An abnormal ECG can indicate various heart-related issues, such as arrhythmias, ischemia, or structural abnormalities. It’s essential to consult with a healthcare professional for an accurate diagnosis and treatment plan.
- Can I interpret my ECG report on my own?
While basic understanding is helpful, ECG interpretation requires professional medical expertise. Always consult with a healthcare provider for an accurate analysis.
- How often should I get an ECG?
The frequency depends on your health condition and risk factors. Your doctor will recommend the appropriate schedule for ECG monitoring.
- Is an ECG test painful?
An ECG is a non-invasive, painless test. It involves placing electrodes on the skin to record the heart’s electrical activity.
- Can ECG detect all heart problems?
While ECG is a crucial tool for diagnosing heart conditions, it may not detect all cardiac abnormalities. Additional tests may be required for a comprehensive assessment.
Conclusion
Understanding your ECG report is akin to deciphering the unique language of your heart. It provides invaluable insights into your cardiac health, guiding decisions for managing and maintaining heart wellness. With advancements in medical technology, interpreting these reports has become more accessible, enabling individuals to play an active role in their healthcare journey. Remember, your heart’s story is told through each line and wave on the ECG; understanding it can lead to a healthier, more fulfilling life. So, when was the last time you listened to what your heart was telling you?


